Figure 1
Scenario 1: Calculation from first principles: the objective in this project was to assess the steam consumption in a distillation column being used to purify acetic acid. The acid enters the process dissolved in an organic solvent, which has been used to strip it from its original aqueous solution. The solvent is then boiled off to leave pure acid. The plant was well instrumented with flow meters and temperature sensors -- for process control purposes – and these were being read at frequent intervals and recorded in a database.
The physics of the process is fairly simple: sensible heat must be supplied to the solvent to raise it from the feed temperature to its boiling point; latent heat must then be supplied to evaporate it. Sensible heat, meanwhile, must be supplied to raise the temperature of the acetic acid from feed to exit conditions. We sampled the flow rates and temperatures at twenty-minute intervals and passed these values (together with information about the feed strength) into a mathematical model which carried out the sensible and latent heat calculations. This gave us twenty-minute records of theoretical heat requirement, which we totalled up at weekly intervals and compared with metered steam consumption.
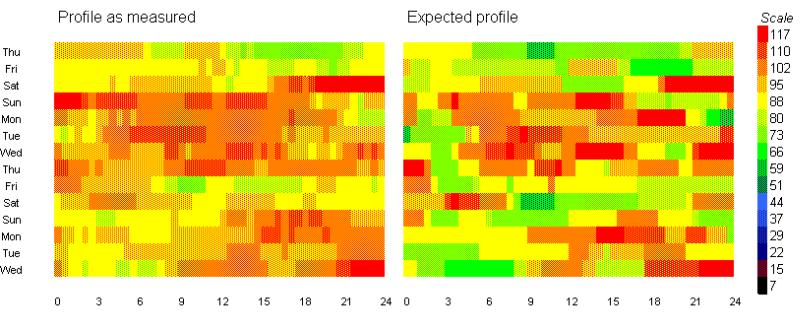
Scenario 2: multiple batch processes on a shared meter: this example concerned a building containing about a dozen vacuum drying units, each dominated by a fan of 10-20 kW power. The power demand of each was established by means of temporary metering. Each week, the start and stop times of all the units were downloaded from the production scheduling system as a spreadsheet from which, knowing the individual unit ratings, the half-hourly expected consumption could be calculated. Figure 1 compares actual and expected consumptions for a two-week period, represented as false-colour caster plots.
Figure 1
The original intention had merely been to provide material in support of ongoing operator motivation and awareness - the idea being to stimulate discussions about the similarities and differences between actual and expected consumption patterns. However, it soon dawned on us that we could total up the half-hourly expected consumptions to provide weekly operating targets.
Scenario 3: multiple meters on a single process line: this project concerned continuous process lines making plastics film, each with a number of electrical submeters connected to an automatic meter reading system. Although some consumption streams were throughput-dependent, we noticed that several submeter consumptions were more dependent on the state of the machine rather than its speed. In a typical case (illustrated, Figure 2), the meter registered 450 kW when the machine was “winding” (producing film) but only 300 kW when product was being dumped prior to the final processing step. At this factory we were able to read an electronic production log at the end of each day, which indicated how many hours each line had been winding and dumping respectively. Simple arithmetic then yielded a consumption estimate for each submeter. Results for actual and expected consumption were then compared at the end of each week.
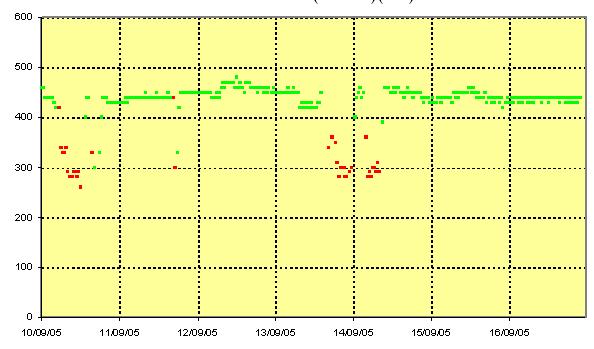
Figure 2
Scenario 4: no gas consumption meters: here we were dealing with a number of small, gas-fired, high-temperature process units with no meters and no practical means of recording production throughput. The units operated continuously at steady firing rates, which the operators measured once a week along with combustion conditions. These spot measurements enabled a spreadsheet to calculate, once a week, the amount of useful energy released into the process, and the quantity lost in the exhaust stream. A certain percentage of stack loss is inevitable, and this provided the yardstick against which avoidable losses could be assessed.
In the first three scenarios we were fortunate in having automatic meter reading systems complemented by (and this is important) automatic collection of production process data to match. Nevertheless, despite the consumption data being available at intervals down to one minute, I preferred to aggregate the data into weekly chunks for assessment and reporting purposes. Weekly assessment has these advantages:
The ability to calculate expected consumption volumes at intervals also underpins the application of cusum analysis – a vital energy-management technique which (a) enables tough-but-fair operating targets to be set, (b) assists in the diagnosis of persistent intractable excess consumption and (c) allows improvement in efficiency to be evaluated objectively in the face of random patterns of production activity.
Vilnis Vesma, 31 October 2005
If you found this page in isolation through a search engine, you might want to check out other free advice from the Energy Management Register