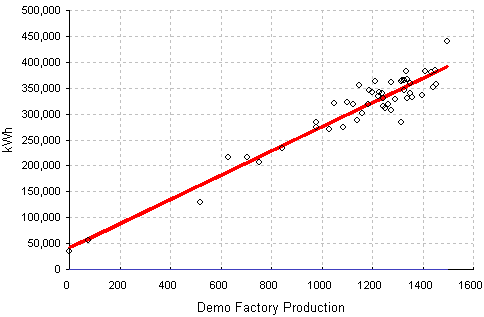
The first step is to plot the weekly (or other equally-timed) observations of consumption and driving factor on an x-y scatter diagram.

Next, fit a straight line through the points. It does not have to be an exact 'best fit' line, because we expect to refine its position later in the procedure. This line is a 'trial' performance characteristic line (PCL).

Using the trial PCL as the performance baseline, draw the cusum chart. The cusum chart will often have this kind of appearance, being broken into segments of different slope. We are interested in any period (if there is one) of sustained downward slope, which indicates consistent performance below the 'trial' performance characteristic.
(Click here for more about the cusum method)

In this example, several weeks at the start of the history fulfil this requirement. this segment of the history has the steepest slope, so we mark those points for further analysis because it represents the period of best performance.

Returning to the scatter diagram, we can now identify the points previously selected from the cusum history.

These 'hand-picked' points can now be analysed, by fitting a straight line through them (this is where your software's regression-analysis feature comes into play). This new line is a provisional target performance characteristic, but it looks somewhat aggressive and needs to be validated if people are going to accept that it is achievable.

If we now recalculate and redraw the cusum chart, using the provisional target derived in the previous step, we find that it contains a sustained period (from A to B) of horizontal running. This proves the achievability of the provisional target.
A target characteristic is "aggressive but achievable" if the resulting cusum chart contains sustained periods of horizontal running with no downward sloping segments.
From B to C on the chart, the upward trend indicates a period of sustained waste.